Ex 14.4 Q3
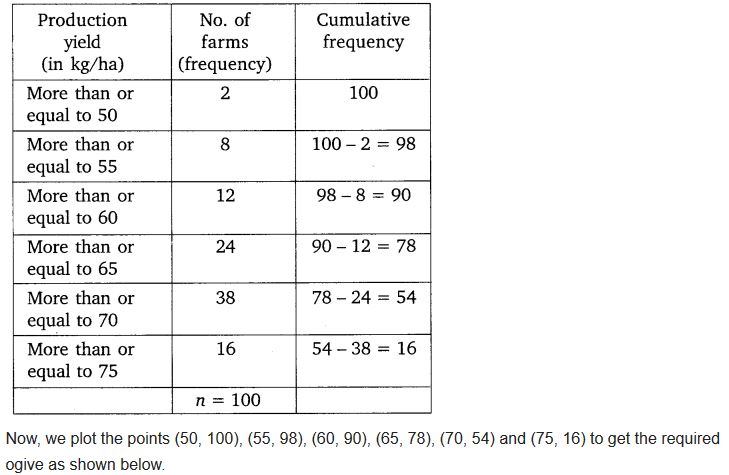
Question The following table gives production yield per hectare of wheat of 100 farms of a village.
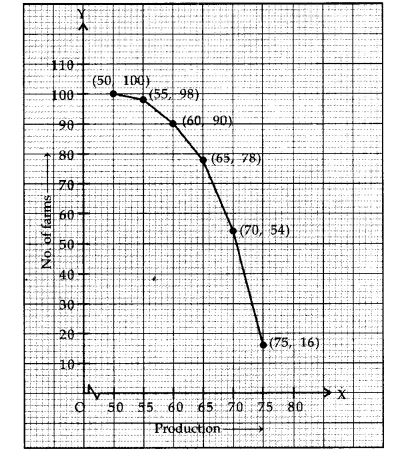
Change the distribution to a more than type distribution, and draw its ogive.
BRIGHT TUTORIALS
BRIGHT TUTORIALS
CBSE Class X | Academic Year 2026-2027
9403781999
Excellence in Education
Mathematics | StatisticsWeb Content
CBSE Class 10 Statistics — Complete Guide
Statistics carries 5-7 marks and is highly scoring. Mean, median, and mode of grouped data are guaranteed questions.
Quick Revision: Key Formulae
- Mean (step deviation): a + (Σfiui/Σfi) × h
- Median: l + [(n/2 − cf)/f] × h
- Mode: l + [(f1−f0)/(2f1−f0−f2)] × h
- Empirical: 3 Median = Mode + 2 Mean
Most Important Questions
- Find mean using step deviation or assumed mean method
- Find median of grouped data
- Find mode of grouped data
- Draw ogive and determine median graphically
About Bright Tutorials
Bright Tutorials, Hariom Nagar, Nashik Road, provides expert coaching for CBSE and ICSE students. Our experienced faculty ensures comprehensive preparation for board exams with personalised attention and 3-tier differentiation for students of all levels. Contact us at 9403781999 or visit brighttutorials.in.